

Japanese Candlesticks are, no doubt, the best and most complete way to see, even at sight, the information we require in our daily trading activities.
With just one candle we can see the opening price, the highest price, the lowest price and the closing price of any investment instrument in any timeframe desired. What more could a trader ask for? Ideally that the chart to help you predict the future price so you can prepare your trading strategy. Well yes, that’s right and Japanese Candlesticks will help with it as well. You just need to learn how to read and analyse them and in this articles I hope I can help you with it. My aim is to help you become and expert in reading and interpretation of Japanese Candlesticks and its patterns.
Origin of the Japanese Candlesticks

A little bit of history may be necessary, just for the sake of general knowledge and to know to whom to thank this brilliant way of reading the price on the charts.
By now you must be guessing that the Japanese Candlesticks were originated in Japan, you are on track. Rightfully, the brilliant idea was originated in Japan, sometime ago during century XVIII. Munehisa Homma, a rice trader, not happy with just knowing the current price of the rice, found a solution and started drawing what we know today as candlestick.
The concept, regardless of its breakthrough, was simple. By a simple simple sight, a candlestick allowed him to know the opening, highest, lowest and closing price. In order to know whether the opening price was lower than the closing and vice versa, the colour of the candlestick would then be either green or red. Some publications though, may show them black (for red) and white (for green). In fact any colour combination is possible, as you can change the settings of your Metatrader 4 to your taste.
There’s however a global consensus to use green as positive and red as negative. Maybe as an exception, in China, due to cultural traditions, red is used as a colour of prosperity and this colour maybe used as a positive sign by Chinese portals and articles.
Overtime and until today, traders keep studying and analysing this method as the most efficient and with the largest amount of information on a chart. Furthermore, based on the different patterns formed, as well as the size of the candlesticks, we are able to prevent future market moves accurately.
There are some single candlesticks that can be used as a signal, whether bullish or bearish. In a chart, you may find as well a combination of candlesticks forming a pattern, again, either bullish or bearish. To master all candlesticks and patterns combinations take some time a hours of study.

Apart from identifying the patterns, you will need to learn when they work best as a single candlestick doesn’t mean anything on its own. Just to give you an example, a pin bar is one the single candlesticks with high profitability chances. However, it does not work always, you will need to identify it at the right place and with the right time frame. Apart from its location, you will need to know when you can enter your and exit your trade in order to make it profitable. Your may want to read this article to learn how to trade bullish and bearish bullish pin bars.
Japanese Candlesticks patterns
A patterns is a combination of two or more candlesticks. Not all patterns mean something but there is a handful group of them with a meaning to traders. We will see here a few, the most popular as well as those not so popular but that are the secret of may profitable traders.
I encourage you to take note and visit this page again if you need it. Before you risk your capital you should identify the patterns in the chart of the previous weeks or even months. Check whether they fulfill the criteria and study whether they would have been profitable or not. Was the pattern shown accurately? What would have been the ideal entry point? Where would the Stop Loss (SL) have been placed? Where the Take Profit (TP)? You will then be prepared to identify the patterns in your real account and trade them.
Please note all patterns introduced in this guide work best on daily chart. You may want to try them out on 4 hours chart, but note that the shorter the time frame the lower the chances of success will be. I don’t recommend to even try in shorter time frame than 4H, don’t waste your time and money. Furthermore, in order to make the pattern work for your, you will have to be strict with their location and overall background as advised below. Don’t just try to find the pattern without taking into account the context. This will be the difference between a successful and a loser trader.
Morning Star (Bullish)
Also known as “Bullish Abandoned Baby” due to the solitude of the small second candlestick. The Morning Star pattern is formed with three candlesticks.


A morning star pattern, typically, means a reversal. It has to appear at the support of a downtrend only.
The first candlestick is typically red and it’s the continuation of a current downtrend. The second can be either red or green, with small body and with long tail at times. Not necessarily always, but at times, there’s a gap in between the first and second candles (now it make sense to call it abandoned baby). Finally, third candlestick has to be green and close much above the second, near the opening of the first.
Basically a morning star pattern is and indication of: downtrend ongoing (1st candle). Downtrend exhaustion and new sellers are not joining it (2nd candle). And bulls take over making the reversal happen from the bottom of the downtrend or support (3rd candle).
You may see single small candlesticks often. Please do not interpret them all as Morning Stars. Let’s review the criteria for a morning star to be one. This will help you trade them with higher probability of success:
- A Morning Star is a formation of three candlesticks.
- The first is red and longer than the second, the second with small body and slightly long tail at times, it can either be red or green. The third candle is always green and closes much above the second, anywhere near the opening of the first or above.
- It appears at the bottom of a downtrend or support of the chart.
Evening Star (Bearish)
Also known as ” Bearish Abandoned Baby” due to the solitude of the small candlestick. The Evening Star pattern is formed with three candlesticks.


An evening star pattern, typically, means a reversal. It has to appear at the resistance of an uptrend only.
The first candlestick is typically green and it’s the continuation of a current uptrend. The second can be either red or green, with small body and with long tail at times. Not necessarily always, but at times, there’s a gap in between the first and second candles (now it make sense to call it abandoned baby). Finally, third candlestick has to be red and close much below the second, near the opening of the first.
Basically an evening star pattern is and indication of: uptrend ongoing (1st candle). Uptrend exhaustion and new buyers are not joining it (2nd candle). And bears take over making the reversal happen from the top of the uptrend or resistance (3rd candle).
You may see single small candlesticks often. Please do not interpret them all as Morning Stars. Let’s review the criteria for a morning star to be one. This will help you trade them with higher probability of success:
- An Evening Star is a formation of three candlesticks.
- The first is green and longer than the second, the second with small body and slightly long tail at times, it can either be red or green. The third candle is always red and closes much below the second, anywhere near the opening of the first or below.
- It appears at the top of an uptrend or resistance of the chart.
Three Soldiers (Bullish)
Three Soldiers, also known as three white soldiers. It is a well known bullish patterns consisting of three candles.
All three candles must be green with considerably big body and no or small tails. The first of the green candles is formed within the body of the previous candle (typically red), being the point of reversal when the uptrend is about to start. The third candle must close above the last candle of the downtrend.
Make sure all criteria described above are met. Traders tend to forget one of the keys that make the three soldiers work and it is that the first of the “soldiers” must be within (inside) the body of the previous candle. The last of the downtrend, giving way to the upcoming uptrend. Without this last condition the pattern may work but, definitely, with lower chances and you may consider not to trade it.
Lastly, upon a big downtrend and a very long red candle, you may encounter three green candles right after. If all three, and particularly the last green candlestick, does not close above the large red, it is not a three soldiers pattern this time. Again, it is best not to trade it.
Three Black Crows (Bearish)
Bullish engulfing
Bearish engulfing
Pin Bar (Bearish)
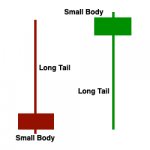
Also known as inverted hanging man, it is one of the most common bearish single candlestick formation. It is a single candlestick with a long tail on top and small body at the bottom. The small body may not even exist and if it does, ideally it should be red, even though some with green body also work quite well. More than the body colour, we need to emphasize where the bearish pin bar is located.
In order to consider a pin bar tradable and profitable we will need to find it at the top of a bullish trend around the resistance level, basically at the top of an uptrend.
Would a pin bar far from the resistance work? It may and it may not. Simply the chances are lower, much lower. I would rather trade only when the odds are in my favour. Even if it works, its earning potential is lower than if found on top of the uptrend, with earning potential being the whole drop and beyond.
Hammer (Bullish)
Also known as inverted pin bar and hanging man, this is one of the most common bullish candlesticks, easier to trade and to identify. It consist of a candlestick with a long tail at the bottom and a small body, or even almost without body on top, ideally. If there’s any body part, it should be green, even though with red body it may work equally well.
As a bullish candlestick, you will have to find it at the bottom of a downtrend. It is the place from where the trend will change to bullish. Basically it is a reversal single candlestick to be located and traded at a support
Would an inverted pin bar work at other locations apart from the support? Well yes but no. If you found a hanging man candlestick within a downtrend and it’s not at the support, it may mean a change of trend or not, it may work or not… Simply its chances to be a reversal sign are minimal and not worth the trade because the downtrend may just continue.
Idea💡 “Master all profitable strategies by joining my PROfessional Price Action Course. I have simplified the way I read charts in order to make it the simplest way ever. Learn how to trade the market now!”
Single candlesticks used for trading
A single candlestick means, in principle, nothing. Many beginner traders make the big mistake of accept as a sell signal just one big red candlestick or buy signal a big green candlestick. Reading and understanding japanese candlesticks and chars is, unfortunately, not that easy and simple.
There are, however, some single candlesticks, with a specific shape and given at the right place, that can be used a signal of reversal or trend continuation. These are not many though but it worth to know them well in order to identify and trade them if all conditions are given.
More Forex & Trading ideas

Read More
Read More
Share! Don’t be greedy
If this complete guide about Japanese Candlesticks has helped you, even if it’s just a little bit and you have learnt one or two things, I will be greatly thankful if you help me spread the words in your social media.